Dating
Apart from written records of construction which exist for most of the hillfigures constructed in the last 250 years, there has been no method of accurately dating hillfigures. That was until the advent of Optical Stimulated Luminescence or OSL about 30 years ago. This was used to date the Uffington White Horse in 1995, and hopefully some other hillfigures in the near future.
Optical Stimulated Luminescence (OSL)
Summary
Optical dating is a method of determining how long ago mineral grains were last exposed to daylight. It is useful to geologists and archaeologists who want to know when a particular event occurred.
Ages can be determined from a few hundred years to 100,000 years, and can be reliable when suitable methods are used and proper checks are done. Ages can be obtained outside this range, but they should be regarded with caution. The accuracy obtainable under optimum circumstances is about 5%.
The minerals that are measured are either quartz or feldspar. There are advantages and disadvantages to using each.
Crucial to the optical dating method is that there was adequate daylight exposure to the mineral grains before they were buried. Aeolian depositional environments, such as sand dunes and loess, usually satisfy this criterion. Some water-laid deposits do too.
Principles of Luminescence Dating
When ionising radiation (predominantly a -, b - or g -radiation) interacts with an insulating crystal lattice (such as quartz or feldspar), a net redistribution of electronic charge takes place. Electrons are stripped from the outer shells of atoms and though most return immediately, a proportion escape and become trapped at ‘meta-stable’ sites within the lattice. The net charge redistribution continues for the duration of the exposure and the amount of trapped charge is therefore related to both the duration and intensity of radiation exposure (ignoring saturation effects).
Even though trapped at meta-stable sites, electrons become ‘free’ once again under certain conditions (if the crystal is heated and/or illuminated). Once liberated a free electron may become trapped once again or may return to a vacant position left by the absence of a previously displaced electron (a ‘hole’). This latter occurrence is termed ‘recombination’ and the location of the hole is described as the ‘recombination centre’. As recombination occurs, a proportion of the energy of the electron is dissipated. Depending upon the nature of the centre where recombination occurs, this energy is expelled as heat and/or light. When the crystal grain is either heated or illuminated following irradiation (the ‘dose’) the total amount of light emitted is therefore related to the number of liberated electrons and available recombination sites. This is the fundamental principle upon which luminescence dating is based, namely that when stimulated (either with light or heat) the amount of light emitted by the crystal sample is proportional to the total absorbed radiation dose (ignoring for the moment the effects of signal saturation).
During the event to be dated, for example when sediment transport occurs, individual crystals are exposed to natural daylight and the trapped charge that accumulated during burial is removed (i.e. the light ‘frees’ the trapped electron population, as described above) - termed ‘re-setting’, ‘zeroing’ or ‘bleaching’ of the signal. On subsequent deposition and burial the crystal grains are once again returned to darkness and trapped charge accumulation proceeds as before. Re-setting of the signal is achieved by heating in the case of pottery. In cases where the duration of dosing (since the last resetting event) is not known, as for dating, estimates can be made from laboratory measurements. The response (the sensitivity) of the sample to radiation dose (i.e. the amount of light observed for a given amount of radiation, usually b -radiation) must be established. This is termed the ‘dose response curve’ or ‘growth curve’. From this relationship the equivalent (in most cases b -) radiation exposure required to reproduce the light level observed following the environmental dose can be estimated. This estimation is called the ‘equivalent dose’ (De). The De is therefore an estimate of the total dose absorbed during the last burial period. If the ‘dose rate’ (the amount of radiation per unit time administered during burial) is known, the duration of the dosing period (the burial age) can be calculated using
Age (years) = De (Gy) / dose rate (Gy per year).
Applications
In order for luminescence dating to be successful, sediment samples (for OSL dating) must have been exposed to sunlight immediately prior to deposition, such as would normally be expected to have occurred during transport by either water or wind. Pottery and burnt flint must have been heated to at least 400° C. The pottery and flint samples must be sufficiently large so that, after removal of a 2mm layer from each surface, a fragment whose volume is equivalent to at least 1cm x 2cm x 3cm remains. In addition, as an absolute minimum, it is essential to provide a sample of the soil (at least 50g) in which the pottery or flint was buried (see Sample Collection for further details).
The typical age range for luminescence dating is ca.10 years to 300,000 years (though this is highly sample dependent). The uncertainty on luminescence dates is typically in the range of ± 5% to ± 12% of the sample age.
Luminescence dating is particularly useful when radiocarbon dating is not possible. This would be the case, for example, when organic material has not been preserved or when the relationship between the organic material and the archaeological context cannot be confidently assumed. Further, luminescence dating may also be of help when the age of the sample is greater than the 40-50,000 year limit of radiocarbon dating.
Discovery
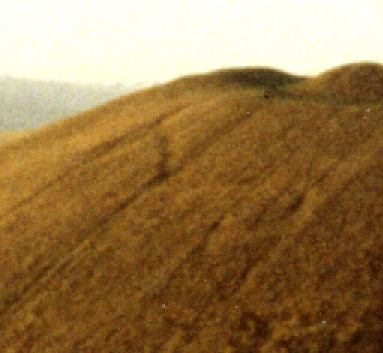
Hillfigures of the past can be discovered in several different ways, literature provides some evidence as do maps but sometimes personal accounts or letters are all the evidence we have for a figure e.g. the Firle figure is mentioned in passing in a book. Serendipity also plays its part, the ploughing of a field near Rockley in 1948 unearthed a horse which was completely unrecorded beforehand.
Photography now plays an important part in hillfigure discovery, filters and light conditions along with vegetation patterns play a part, a more on the ground method is to use resistivity of the earth.
Photography
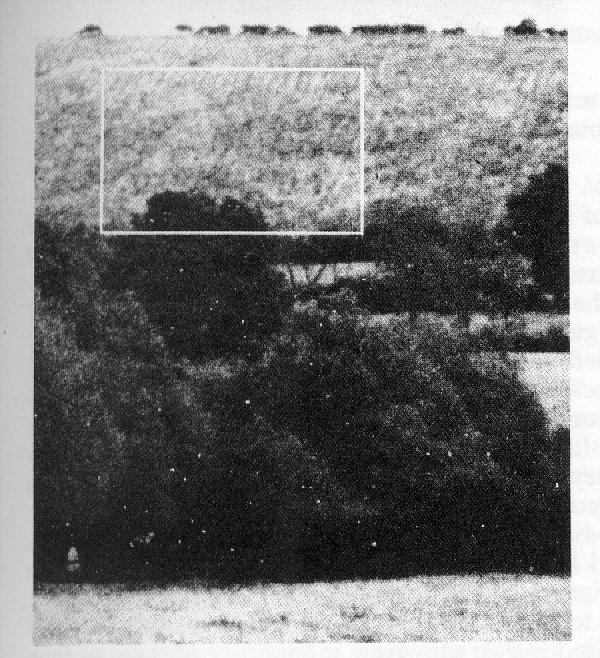
Obviously there has to be some optical evidence to see a lost figure in a photograph, this may mainfest itself in two ways, weather / light conditions or vegetation effects. A hillfigure that has grown over often produces a discoloured patch of vegetation this is due to the disturbance of the underlying ground and often the thinness of the soil on the figure. The plant life is usually less lush and grows less quickly. This may not always be seen with the naked eye and sometime filters are needed.
Two examples illustrate this,
Devizes White Horse
Red Horse of Tysoe
Resistivity Surveys
Ground resistivity measures the electrical resistivity of the subsurface materials, which include soil and groundwater characteristics, from survey stations at the ground surface. It is easy to use in the field and its results are often less ambiguous than those of other methods. The technique detects archaeological features by measuring variations in the electrical conductivity of the ground caused by the changes in the material and moisture content resulting from the presence of these features.
Application of the ground resistivity method requires that an electrical current be injected into the ground by surface electrodes. The resulting potential field (voltage) is measured at the surface by a voltmeter between electrodes.
The resistivity of the subsurface materials can be calculated by knowing the electrode spacing, geometry of the electrode positions, applied current, and measured voltage. Ground resistivity measurements are reported in the units of ohm-meters or ohm-feet.
The depth of the resistivity measurement is related to the spacing of the electrodes and may vary depending on the subsurface conditions.
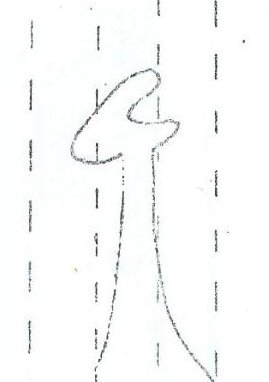
This method was used to confirm the outline of the head of the Tysoe red horse.
Outline from Photo - Outline from Resisitivty Survey
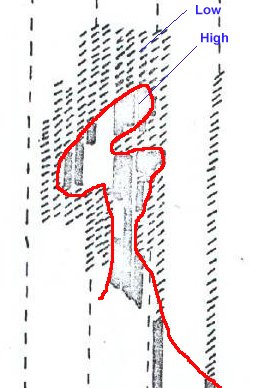
Solid area - High Resisitivity, Hatched Area - Low Resistivity
Just a note on a slightly different method used by T.C. Lethebridge on Wandelbury Hill, to find the Wandelbury figures. He used a stainless steel bar 5'9" long which when smacked against the ground sounds through the topsoil for missing ditches, the sound differs from the norm. This was treated with some scepcisism at the time!